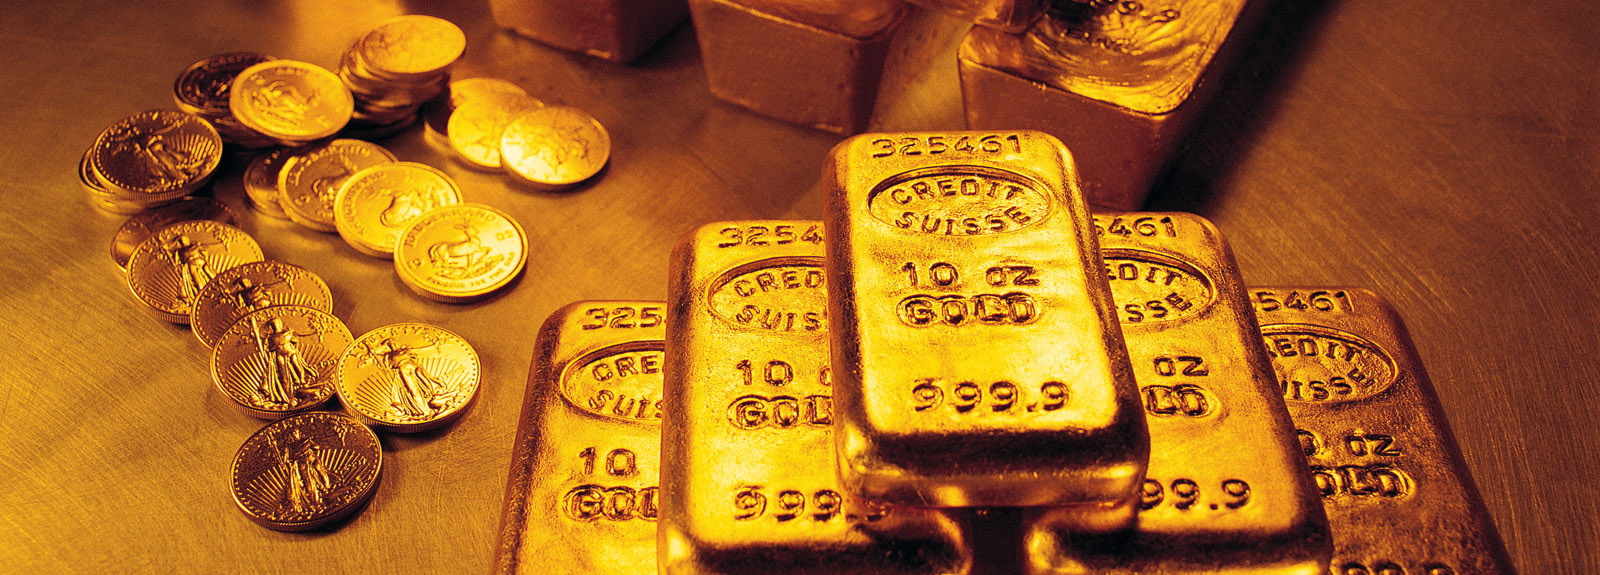
Mining Riches of the Golden Triangle
Mining Riches of the Golden Triangle
By Matt Badiali
My first visit to the Golden Triangle required a flight so beautiful and harrowing, I tell people it was as
close to skydiving as I’d like to get.
I flew up to this remote corner of British Columbia in the summer of 2007 to visit the largest gold deposit
ever found in Canada. The site is far from anything. To be specific, you can only reach this outpost by taking a
helicopter ride from the mining town of Stewart, British Columbia (pop. 700).
From the front seat of the helicopter, I watched the mountains soar above me, while glaciers, striped like
pulled toffee, stretched out below. We’d be a hundred feet above snow, often with a ragged ridge of rock on
either side. Then suddenly, the ground would drop thousands of feet down to the valley.
The region is endowed with more than its fair share of gold, copper, and molybdenum. The barren cliffs
look like a geological textbook open to the chapter on giant copper-gold porphyry systems. Whole mountain-
sides stand out, orange and stained. From the helicopter, the minerals looked like a giant ribbon of orange sher-
bet swirled through the mountains.
We flew past several streams stained bright blue from copper leaching out of the rock. You often see that
kind of staining on copper building facades, but I saw it on sheer mountain faces. I’ve never seen anything like
that coming from rocks before. It was awesome.
The kaleidoscope landscape reflects the vast mineral wealth trapped in the Golden Triangle.
One of the gold veins in the Golden Triangle is so prolific, one geologist called it “the highest grade gold
I’ve seen in my career… and I’ve been in the business since 1976.” And the deposit grows with each land survey.
Since its initial discovery, reserves have increased by almost 500%.
Another deposit, located practically right next door, contains even more gold. In fact, a Vancouver Sunarti-
cle recently described it as “the largest gold deposit ever found in Canada.”
And yet another find, Pierre Gratton, CEO of the Mining Association of British Columbia, calls it simply,
“Too large to ignore.”
Altogether, this tiny area holds an estimated 15 world-class gold deposits – UNTOUCHED.
It’s why the British Columbian and Canadian governments are spending nearly $300 million to run a 200-
mile electrical line through the region. The power line will kick off a mine construction boom that will generate
hundreds of times the cost in taxes over the next decade.
This mineral-rich zone has been virtually off-limits to mining companies for the past 150 years because of
its remote location and lack of power infrastructure. But that’s about to change…
Better yet for investors like us, we can invest in three small mining companies that control huge assets in
the Golden Triangle. You see, a few years ago, this unique group of companies began buying prime deposits in
the region at dirt-cheap prices, anticipating the infrastructure would eventually reach the Golden Triangle.
1
These small companies knew that if a power grid were ever built in the Golden Triangle, the land there
would be worth an absolute fortune.
In the next 12-24 months – when the new power grid is scheduled to go online – one of the greatest
untapped sources of wealth in Canada will finally be open for mining.
And each of these companies is in control of deposits worth several times the value of their business.
Today, you can get in on these projects before they become operational. As I’ll show, the biggest gains are
likely to come as word of this development reaches the mainstream press.
In pages that follow, I’ll detail everything you need to know about this opportunity… the group of mining
companies… their upcoming mining projects… how much they stand to make… and why this development
hasn’t yet been factored into their share prices…
What Is the Golden Triangle?
The Golden Triangle is a section of Northwestern British Columbia that’s roughly the size of Connecticut
and holds about 935 documented mineral occurrences – that means initial fieldwork turned up 935 locations
that could have mine-worthy concentrations of metals.
Not all of them will pan out… maybe one, maybe 100. It’s too early to tell. But 935 is a huge number for
an area the size of the Golden Triangle – that’s a whole lot of leads to follow up.
Of those, another 67 projects up are promising enough that the company holding its rights have taken the
next step and calculated a resource. These range in size from thousands to millions of tons in volume. Many of
those are large-volume and low-grade gold- and copper-rich “porphyry” deposits.
Porphyry deposits are the second-most economically important type of mineral deposit (after iron ore).
They occur all over the world and can contain gold, copper, molybdenum, tungsten, and tin. These deposits
usually contain metal concentrations between 100 and 10,000 times normal rock… and they can be gigantic.
Porphyries can run anywhere from 10 million to 10 billion tons. For example, the world’s largest under-
ground copper mine, El Teniente in Chile, is a porphyry deposit. So is the Grasberg mine in Indonesia, the
world’s largest gold mine (and third-largest copper mine).
The Golden Triangle is pimpled with these giant deposits. Some of them are barren – just huge expanses of
iron pyrite (fools gold). However, others contain enough gold, copper, silver, molybdenum, and other metals to
make excellent mines.
This region is abnormally endowed with these deposits thanks to the “Ring of Fire.” The same process that
forms the giant volcanoes that ring the Pacific Rim also caused these porphyry deposits to form. It heated up
the water, filled it with metals, and sent it blasting into the rocks.
You might ask, “If the Golden Triangle is so great, then why aren’t the mines already there?”
The answer is infrastructure. These projects are far… very far… from roads, people, and power lines. Those
facilities are as important to a mine’s feasibility as ore grades. Those problems actually sunk one Golden Triangle
project in spectacular fashion in 2007.
2
3
NovaGold Resources’ Galore Creek is a typical low-grade copper/gold porphyry deposit. At $3-a-pound
copper and $1,100-per-ounce gold, a ton of rock at Galore is worth about $40 ($10 of gold and $30 of copper)
before operating costs. Sounds good… until you look at the capital costs…
The cost to build the project, because it was so far from roads and power, rose to $5 billion. It takes a
whole lot of tons… at $40 per ton… to pay off a $5 billion loan. So in late 2007, the project came to a
screeching halt, and NG share price collapsed from $20 to $6 in about a month.
But now… some extremely high-profile investors are buying NovaGold Resources right now. Wall Street
icons like John Paulson and George Soros together put more than $175 million into the stock, recently. You
don’t have to be a mine financier to see that NovaGold’s ounces are cheap. They trade for about $38 per ounce,
while the industry average for resources is around $150 per ounce.
The reason is simple: Electricity is coming to the Golden Triangle, and it could send these stocks up
hundreds of percent.
The British Columbia and Canadian
governments are running a new power
line along the Highway 37 corridor
through the heart of the Golden Triangle.
Canadian politicians believe the line will
spur the development of 11 new mines
that, in turn, will generate $15 billion in
private investment, create as many as
11,000 jobs, and produce $300 million
in annual tax revenues
British Columbia is an excellent
jurisdiction to build a mine. It’s mine-
friendly – five mines have opened there
in the last three years. Another 50 proj-
ects are in the engineering stage (called
pre-feasibility), and 100 more projects
show encouraging exploration results.
The new power line will pass within
20 miles of Galore Creek. That will
improve capital costs and boost
NovaGold’s price-per-ounce ratio. So you
can speculate on what the market is will-
ing to pay for those ounces in the
ground, without really worrying about
the mine’s economics.
That’s what Paulson and Soros are doing, buying cheap ounces and hoping the new power line boosts their
value… and they are making a huge mistake. They bought into hype and made a classic novice resource
investor’s mistake. I’ve been up there, I talk to geologists who make their living up there, and I know what we
need to buy. It isn’t Galore Creek.
Our Golden Catalyst
As we discussed earlier, the region above Stewart, British Columbia is wilderness. That’s why mining proj-
ects up there get little credit… that and the implosion of Galore Creek.
The market discounts giant gold deposits in British Columbia’s Golden Triangle by about 87%compared to
the average resources in the gold industry. That’s a curious thing because British Columbia committed millions of
dollars to build that new power line and help build mines on those assets.
The market seems to be overreacting. We can buy enormous gold projects for about $19 per ounce that
will become mines in the next 10 years. Other investors spending $150 an ounce to buy gold deposits that may
never become mines and sit in far dicier political climates – places like Romania, for example.
The only reason I can see for such a huge discount is infrastructure problems.
If the market will pay about $150 per ounce for resources elsewhere, I think it will pay that much for
resources in the Golden Triangle, once the power line comes through. That’s why I believe we’re going to make
a whole lot of money in British Columbia. Since the Galore Creek debacle, the market treats mining projects in
British Columbia as if they were in Venezuela. They get little credit, compared with mines in other jurisdic-
tions… like Africa for example.
Why would anyone pay more money for African or Romanian gold than Canadian gold? It simply doesn’t
make sense. That’s a market inefficiency, and we’re going to jump on it.
We’re paying less than $20 per resource ounce for politically safe gold deposits in a mining-friendly region.
The only problem with these projects is infrastructure… and that’s changing rapidly.
Over the next two years, we should see our investment skyrocket by 400% as the new power line evolves
from blueprint to reality. That will do two things. First, it will show the world that the gold in British
4
The British Columbia government has identified these 11 projects as one that will become mines thanks
to the new Highway 37 power line:
Mine Company Symbol Market Value
Red Chris Imperial Metals TSX: III $555 million
Galore Creek NovaGold AMEX: NG $1.4 billion
Schaft Creek Copper Fox Metals TSX V: CUU $40 million
Turnagain Hard Creek Nickel TSX: HNC $57 million
Mount Klappan Fortune Minerals TSX: FT $95 million
Kutcho Capstone Mining TSX: CS $591 million
GJ/Kinaskan NGEx TSX: NGQ $147 million
Snowfields Silver Standard Res. NASDAQ: SSRI $1.4 billion
KSM Seabridge Gold AMEX: SA $823 million
Bronson Slope Skyline Gold TSX V: SK $8.6 million
Storie Columbia Yukon Exploration TSX V: CYU $10.4 million
We can speculate on these, but I’ve narrowed the field down to the three best investments.
Columbia can and will be mined. Second, with the new power line, our gold will go from low-priced resources
to full-priced reserves.
The value of those reserves will be at least $150 per ounce, and probably closer to the industry aver-
age of $266 per ounce. That’s at least a 400% gain on our investment.
That’s change we can invest in.
We’re going to buy three companies with near-term assets that will soon become mines: Seabridge Gold
(AMEX: SA), Silver Standard Resources (Nasdaq: SSRI), and Imperial Metals (TSX: III). These three com-
panies, more than any others in the area, will soar when the new power line comes in and they announce plans
to mine.
Seabridge Gold – Sleeping Giant
Seabridge Gold is an $850 million gold explorer that owns the Kerr-Sulphurets-Mitchell (KSM) project, the
largest gold deposit ever found in Canada. It’s measured
and indicated gold resource is 38.94 million ounces. Its
inferred gold resource is 10.4 million ounces.
This is the Golden Triangle site I visited in 2007.
I was impressed then, but I’m far more impressed
today – it’s 276% larger than when I saw it.
The Mitchell portion of the KSM project was
discovered in 2006. When I went out, the resource
was a remarkable 13 million ounces. The crew was
excited – the guys knew Mitchell was a once-in-a-life-
time discovery. They had no idea it would grow to its
present size. I think it’s going to continue to grow
because Seabridge still has promising areas that
remain undrilled.
Seabrige is what’s known in the mining industry
as a “hoarder.” Seabridge’s management doesn’t want
to operate a mine. Its goal is to buy promising assets,
add value through exploration, and sell the projects.
Even though KSM is close to construction, Seabrige
don’t want to be in that business – it will find a part-
ner or buyer to build and operate a mine. The final
deal will be whatever brings the most shareholder
value for the asset.
The company owns 100% of KSM, along with
the 10.2 million-ounce Courageous Lake (located
north of Yellowknife in the Northwest Territories) and
a handful of other, smaller projects. If you just con-
sider the measured and indicated resources at KSM
5
Why Investors Pay More for
‘Resources’ Than ‘Reserves’
When valuing gold companies, you have to look at
how much of the precious metal they hold. And those
assets are described in terms of resources and reserves.
I’ve only talked about the resource of KSM so far.
That’s just the volume of the rock that holds the good
stuff. The resource categories (measured, indicated,
and inferred), in decreasing order, refer to the accuracy
of the volume measurement. Engineers calculate the
resource from assays (which tell us the amount of gold
and other metals) along drill cores. The more drill
holes, the higher the accuracy.
More valuable than resources are reserves. A
reserve is the portion of the resource that a mining
engineer says can be mined economically. That requires
a whole lot of study and expense to figure out.
It’s important to understand the difference,
because the market values the two assets differently.
The average price for resources is about $150 per
ounce. The average price for reserves is $266 per ounce.
Today, KSM only has a resource… but within the
next few weeks it will have a reserve estimate. This will
represent a crucial milestone for Seabridge… and as I’ll
explain, it will send its share price rocketing.
and Courageous Lake, we’re buying 43.1 million ounces of gold for just $19.75 per ounce. That number is
going to get a whole lot more expensive soon, so we need to buy now.
We’re mainly interested in KSM because it sits at the southern end of the Golden Triangle. This giant proj-
ect is just 18 months away from the start of mine construction.
The prefeasibility study should come out sometime in the next few weeks. In it we will find the details of
the mine – cost of construction, size and shape of the mine, and the reserve calculation. Once the prefeasibility
comes out, there is just 12 to 18 months of permitting necessary before mine construction.
That will change Seabridge’s value considerably. Before we get into its value, let’s take a look at its business.
The company recently added $61 million in cash from a financing, which means it has plenty of money to
do its work and keep the lights on for at least two years. It has 40.5 million shares outstanding, 42.3 million
fully diluted. That means the company owns more than an ounce of gold for every outstanding share.
This year will be pivotal for Seabridge. It plans to drill both KSM and Courageous Lake this summer. The
goal is to increase both the reserves at KSM and the quality of the resource at Courageous Lake.
I think they are both important, but let’s focus on KSM, because that’s where our immediate gains will
come from. Let’s do a quick comparison to Kinross Gold’s Cerro Casale project in Chile. Cerro Casale is a simi-
lar low-grade gold and copper deposit. Here are the details of the two, side by side:
Cerro Casale KSM
M&I Gold Resource (Oz) 25.4 million 38.9 million
M&I Copper Resource (Pounds) 6.4 billion 10 billion
Gold Reserves (Oz) 21 million None Yet
Gold Grade (grams per ton) 0.59 0.57
Copper Grade (%) 0.22% 0.21%
You can see KSM is about 50% larger than Cerro Casale. Barrick Gold recently paid $475 million for 25%
of the project. That implies a $1.9 billion value for Cerro Casale. That puts KSM’s value at $2.9 billion. That’s
235% more than Seabridge’s current market value.
The most important point on that table is KSM doesn’t have reserves yet. As I mentioned earlier, those will
be published soon. So we should see gradual appreciation of Seabridge’s shares. However, it could also skyrocket
up towards the industry average…which would value those ounces around $12 billion.
Here’s the way Seabridge’s net asset value breaks down right now:
Asset Value
KSM $2.9 billion
Courageous Lake $190 million
Other Projects $25 million
Cash $62.5 million
Total $3.2 billion
6
As you can see, at $850 million market cap, Seabridge trades for a fraction of its asset value, mainly because
the market doesn’t believe KSM is mineable. That’s about to change. Seabridge will release its prefeasibility
study for KSM within the next few weeks. With that will come a reserve calculation that proves KSM can be
mined profitably.
That will stun the market. I’ll be disappointed if Seabridge shares don’t double this year, based on that
report alone.
Recommendation: Buy Seabridge Gold (AMEX: SA) up to $35 per share and use a 50% trailing stop.
The Golden Triangle’s Game Changer… Snowfields
While Seabridge doesn’t plan to operate any mines… our next stock does. Silver Standard Resources
(Nasdaq: SSRI), which made its name as a hoarder, is shifting its business model to more traditional mining…
And one of its key mines is in the Golden Triangle.
This isn’t the first time the company had changed radically. In 1998, then CEO Robert Quartermain knew
silver projects were more valuable in the ground than as mines. So he decided to stop mining and become a
resource hoarder. He decided to hold great silver projects and wait until the market would pay what he thought
they were worth.
It was a risky plan. It required faith the value of silver would rise and a team of expert geologists and engi-
neers to continue scouting out the best deposits (plus the cash to buy them).
The gamble paid off enormously. By 2005, silver traded for $10 an ounce… Quartermain’s investors made
9,900% from 1998 to 2005.
Then, Quartermain decided it was time to go back to mining. The catalyst was a giant silver project in
northwest Argentina, called Pirquitas.
Thanks to that hoarding history, Silver Standard compiled a fantastic portfolio of assets. And its resources
outnumbered reserves by 10:1. Shifting to a mining model would increase the market value of those ounces, in
part, because developing a mine necessarily shifts the assets from resources to reserves.
That’s exactly what is happening.
In 2009, the company added 100 million ounces of silver to its proven reserves… about a 30% increase.
Again, investors value reserves much higher than resources. In the case of gold, reserves are 60% more valuable
in the market.
Silver Standard is now a $1.4 billion company, and its shares are up about 40% in the last 12 months – a
fantastic gain, but a fraction of what I expect. That’s because problems dogged the company and its Pirquitas
mine in 2009, holding back share prices and ultimately hastening Quartermain’s resignation.
The Pirquitas mine in Northern Argentina produced 1.1 million ounces of silver in 2009. It’s one of the
largest primary silver mines in the world, but it has some growing pains. The operating costs at Pirquitas were
7
too high, around $16.50 per ounce of silver. That’s an engineering problem, which the company is addressing.
While it should be a short-term problem, the high costs caused investors to dump Silver Standard shares.
The share price fell from $24 to $17 based on difficulties at Pirquitas and a massive public share offering.
In February 2010, the company raised $108.7 million by selling 6.7 million shares at $17 per share. Investors
were disappointed in the price and sold.
The company raised another $15 million just this month (March 2010) by selling its noncore Silvertip
project to Silvercorp, which paid $7.5 million cash and 1.2 million shares. These funds are important for the
continued growth of Silver Standard because they will pay for the conversion of more resources to reserves.
Together with its $26.6 million in cash on the balance sheet, that gives Silver Standard about $142 million
in cash. That money is extremely important for the continued growth of Silver Standard – because developing
mines is expensive work. That cash will pay for the conversion of more resources to reserves and continue to
drive the value up.
That conversion from resources to reserves will drive slow steady growth in our investment. However, the
best assets in Silver Standard’s portfolio are in the Golden Triangle. Those two projects could drive a massive
gain in Silver Standard’s shares. Here’s why…
Silver Standard owns two neighboring projects to KSM: Snowfields and Bruce Jack. Snowfields lies almost
directly up the mountain above the Mitchell project. In total, the main zones are about 6 miles from KSM.
These two projects hold 25% of Silver Standard’s total resources. The deposits are genetically similar to
KSM, probably formed from the same geologic event.
KSM Snowfields Bruce Jack
Total* Gold Resource (Oz) 49.3 million 10.1 million 4.9 million
Total* Copper Resource (Lbs) 12.7 billion 1.4 billion None
Total* Silver Resource (Oz) None 43.7 million 71.5 million
Gold Grade (grams per ton) 0.57 0.3 0.8
Copper Grade (%) 0.21% 0.07% None
Silver Grade (grams per ton) None 1.4 11.2
*Includes Measured, Indicated, and Inferred Resource
Snowfields and Bruce Jack add an important extra dimension to KSM. They tell us the mineral system here
is absolutely enormous AND more deposits likely await discovery. When I visited KSM, Bruce Jack wasn’t even
drilled yet. Now it’s an enormous deposit.
Snowfields and Bruce Jack are still early stage. The resources are still inferred, which means they needs
much more drilling. However, it’s clear this is an enormous mineralized area with a gold endowment of 66 mil-
lion ounces identified so far. We aren’t even considering the mineable silver, copper, and molybdenum.
Based on our earlier discussion of Cerro Casale and KSM’s value, we can conservatively estimate Snowfields
and Bruce Jack’s value around $1 billion. That’s 70% of Silver Standard’s market value. With Seabridge’s
impending feasibility study and the new power line coming through, these two projects should add considerable
value to Silver Standard over the next 12 to 18 months.
8
Here’s a brief summary of Silver Standard’s assets:
Asset Status Location Approximate Value
Pirquitas Mine Production Northern Argentina $880 million*
Pitarilla Mine Feasibility Durango, Mexico $107 million*
San Luis Project Feasibility Northern Peru $20 million**
Snowfields/Bruce Jack Development Golden Triangle $1 billion
Cash $142 million
Total Value ~$2.2 billion
*Net Present Value Based on $11 per ounce Silver. **Rough estimate based on resources. A closer estimate
will come out in mid-2010 with the feasibility study.
Based on a rough estimate, Silver Standard trades at a 64% discount to its net asset value. Much of that is
tied up in its Golden Triangle projects. That’s what makes the new power line so important to Silver Standard’s
future.
With Seabridge’s impending feasibility study and the new power line coming through, these two projects
should add considerable value to Silver Standard over the next 12 to 18 months.
Taken all together, this part of the Golden Triangle must be on every major mining company’s hot list…
That’s why I’m recommending the company again. I think it’s significantly undervalued. It’s getting almost
no recognition for Snowfields and Bruce Jack because the difficulties at Pirquitas. Once the new power line
focuses attention on this region, and Seabridge announces its reserves, we should see shares of Silver Standard
come back up to at least its previous high of $24 per share…another 37% from here.
Recommendation: Buy Silver Standard (NASDAQ: SSRI) up to $20 and use a 50% trailing stop.
The Big Speculation – Imperial Metals
Imperial Metals (TSX: III) is a tremendous success story. This small mining company operates two copper
and mixed-metal mines at Mount Polley and Huckleberry in British Columbia.
Like nearly every base-metal mining company last year, Imperial entered 2009 in trouble. Metal prices were
in the dumps, the company was bleeding money from its mines, and its share price was around $1 per share.
However, as the economic situation improved, its share price rebounded from a low of $1 in October 2008
to close the year at $2.70. In the first quarter of 2009, it earned (before interest, taxes, depreciation, and amorti-
zation or EBITDA) $6.5 million on $34.7 million in sales.
However, it reported a net loss of 14 cents per share. The market for copper looked bleak and investors
refused to buy. By February, its share price fell back to $2.27, which would be its low point for the year.
Each quarter its earnings improved and its share price rose. By the end of the third quarter 2009, the com-
pany reported EBITDA of $15 million on sales of $54 million and a positive cash flow of $8 million. The share
price soared to a high of $15.30 in December 2009.
9
That’s a 574% gain in months.
At $556 million market value, the company trades at just about 9 times its annual EBITDA (based on its
third quarter results). However, Imperial trades about 20% below its net asset value:
Asset Value
Mt. Polley $240 million
Huckleberry (50%) $50 million*
Red Chris $370 million**
Cash $29.6 million
Total $690 million
*Huckleberry has less than 2 years of mine life remaining.
**Based on $600 per ounce gold and original mine plan
That means the company is relatively cheap…but I think it could double in value in 2010…here’s why.
In addition to the new power line, the game changer was a press release in October 2009. In it, the compa-
ny reported some interesting results at its Red Chris project, in the northern part of the Golden Triangle.
Red Chris is a controversial mining project with similar characteristics to Cerro Casale and KSM. It’s locat-
ed at the northern end of the Golden Triangle, just 12 miles off highway 37.
A feasibility study, completed in 2005, outlined a small pit containing 2.3 million ounces of gold and 2.1
billion pounds of copper. The mine’s economics looked good at the time, based on $1 per pound of copper and
$400 per ounce gold price. In the original report, the company projected the value of the project at $370 mil-
lion at the maximum gold price of $600 per ounce.
That means Red Chris could be a huge money maker…the big problem was lack of power. The project was
250 miles from the nearest electric line. No power, no mine.
However, Imperial kept working on the project. During the initial exploration, the drilling never went
below 1,200 feet, which is about the limit of an open pit mine. In 2007, Imperial drilled to 3,300 feet and
made a huge discovery. The ore’s grade was much higher at that depth.
The exploration continued and in 2009, the company really made a big discovery. It hit nearly 500 feet of
rock that was 4.12% copper and held 8.8 grams of gold per ton. That’s 33 times the average gold grade and
nearly 12 times the average copper grade in the original mine plan. This new discovery was just 300 feet below
the original mine’s bottom.
This is a huge discovery. It will dramatically increase the size and the grade at Red Chris. The company
plans to aggressively explore here in 2010, and I expect that drilling success to continue.
However, investing on the hopes of successful exploration is risky. In this case, I think we have a couple of
factors working in our favor. First, we are buying the company at 9 times earnings, which is at the low end of
the mining industry. However, that doesn’t give any value to Red Chris, which is where the market is wrong.
The value of Imperial will improve dramatically when the new power line goes in. At that point, Red Chris
becomes a viable third operating mine. At today’s gold price, Red Chris will be extraordinarily profitable. The
market isn’t giving Imperial any value for Red Chris’ gold.
10
In addition, the market isn’t pricing in any upside at Red Chris. I met in early March 2010 with one of the
exploration geologists working on Red Chris at a mining industry conference in Toronto. He thinks the highest
grade is concentrated in a “cupola” – a cone-like formation where ancient hot, metal-rich fluids invaded the sur-
rounding rock before cooling.
He explained the concept and walked me through the geology. He thinks the best rock is still to come…
and I believe him.
If the company puts up spectacular numbers at Red Chris this summer, I think we’ll see the stock double as
the market comes to these same conclusions. The impact of the power line, plus robust economics at the mine,
will combine to push Imperial’s share price straight up.
We must remember Red Chris is still exploration stage. That makes this a speculative play. So you must
keep your position size small… less than of 1% of your entire portfolio. If the company puts up spectacular
numbers at Red Chris this summer, I think we’ll see the stock double. If it doesn’t, then this stock will move
with the copper price… that could be bad. So, invest cautiously here.
Recommendation: Buy Imperial Metals (TSX: III) up to $17.25 per share and use a 50% trailing stop.
Do not risk capital that you can’t afford to lose when buying this stock.

thanks maya…good info.
so, what are we all guessing the total gold oz’s will be? Since we have now 2.1 mil oz indicated and 335 thou inferred. Call it 2.5 total…. from May 09. So how much more gold have they found in a Year? another 1 mi, another 2 mil? I think they started drilling in 05. and it took them 4 yrs to get the 2.5. ……. So I say they come up w/ another 2 mil oz of gold. Then a total will be 4.5 mil up to this may. Maybe 4 mil indicated , and another 500 thou inferred.
Other guesses??
and if we have 4.5 mil oz of Gold…. what should our sp be? or what will it be.? I say near 2.
The Greek debt crisis shows signs of spilling into Spain and Portugal, but could all of the First World soon be entangled? Paul Kedrosky, who writes the Infectious Greed blog, makes the outlier (his word) case for a First World debt relief conference between 2012 and 2015.
His reasoning: High levels of debt could cause more collapses; the debt is interlocked among various countries; and it is a drag on economic growth.
“We watch Greece’s rescue continue, while troubles cross the membrane into Spain, Portugal, and elsewhere, and the U.S. remains the largest ticking debt-bomb on the face of the planet,” he said.
“It is going to increasingly seem to more and more debtholders around the world time to have a discussion about what we do.”
He also thinks the calls for such a conference will come from emerging markets, such as China, because they hold so much debt and have a lot to lose if things go awry.